Introduction
Hey there, tech adventurers! Ready to embark on a journey to secure and monitor your network like a pro? Today, we’re diving into the exciting world of network monitoring by setting up and configuring three fantastic tools: Nagios Core, Zabbix, and Zeek (formerly known as Bro). Let’s get this party started!

What Are These Tools?
Nagios Core: Think of Nagios as your network watchdog. It keeps an eye on all your network devices and services, alerting you if something goes wrong. Imagine having a super vigilant guard dog that never sleeps!
Zabbix: Zabbix is your network’s personal health tracker. It collects and displays data on your network’s performance, helping you to visualize and troubleshoot issues. It's like having a fitness tracker for your network!
Zeek: Zeek is the detective in your network. It analyzes network traffic in-depth, looking for suspicious activities and helping you understand what’s happening under the hood. Picture Sherlock Holmes sifting through your network packets!
Installation and Configuration
Let’s break down the installation process for each tool. Roll up your sleeves and get ready to get your hands dirty!
Nagios Core
Step 1: Install Dependencies
sudo apt update
sudo apt install -y apache2 libapache2-mod-php php wget unzip
Step 2: Create Nagios User and Group
sudo useradd nagios
sudo groupadd nagcmd
sudo usermod -a -G nagcmd nagios
sudo usermod -a -G nagcmd www-data
Step 3: Download and Install Nagios Core
cd /tmp
curl -JLO https://go.nagios.org/get-core/4-5-3/
tar -xvzf nagios-4.5.3.tar.gz
cd nagios-4.5.3
./configure --with-command-group=nagcmd
make all
sudo make install
sudo make install-commandmode
sudo make install-init
sudo make install-config
sudo make install-webconf
Step 4: Install Nagios Plugins
cd /tmp
wget https://nagios-plugins.org/download/nagios-plugins-2.4.11.tar.gz
tar -xvzf nagios-plugins-2.4.11.tar.gz
cd nagios-plugins-2.4.11
./configure --with-nagios-user=nagios --with-nagios-group=nagios --with-openssl
make
sudo make install
Step 5: Configure Apache for Nagios
sudo a2enmod rewrite
sudo a2enmod cgi
sudo htpasswd -c /usr/local/nagios/etc/htpasswd.users nagiosadmin
sudo systemctl restart apache2
Step 6: Start Nagios Service
sudo systemctl enable nagios
sudo systemctl start nagios
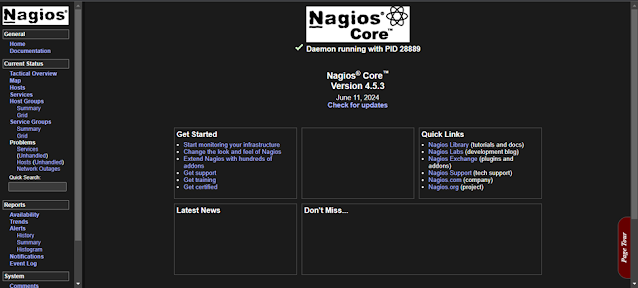
Step 7: Access Nagios Web Interface
Open your browser and navigate to http://<your-server-ip>/nagios.
Zabbix
Step 1: Install Zabbix Repository
sudo -swget https://repo.zabbix.com/zabbix/7.0/ubuntu/pool/main/z/zabbix-release/zabbix-release_7.0-2+ubuntu24.04_all.deb
sudo dpkg -i zabbix-release_7.0-2+ubuntu24.04_all.deb
apt update
Step 2: Install Zabbix Server, Web Frontend, and Agent
apt install zabbix-server-mysql zabbix-frontend-php zabbix-apache-conf zabbix-sql-scripts zabbix-agent
Step 3: Create Initial Database
apt install -y mysql-server
sudo mysql -uroot -p
mysql> create database zabbix character set utf8mb4 collate utf8mb4_bin;
mysql> create user zabbix@localhost identified by 'password';
mysql> grant all privileges on zabbix.* to zabbix@localhost;
mysql> set global log_bin_trust_function_creators = 1;
mysql> quit;
Step 4: Import Initial Schema and Data
zcat /usr/share/zabbix-sql-scripts/mysql/server.sql.gz | mysql --default-character-set=utf8mb4 -uzabbix -p zabbix#Disable log_bin_trust_function_creators option after importing database schema.mysql -uroot -p

mysql> set global log_bin_trust_function_creators = 0;
mysql> quit;
Step 5: Configure Zabbix Server
nano /etc/zabbix/zabbix_server.conf
Update the following lines:
DBName=zabbix
DBUser=zabbix
DBPassword=password

Step 6: Start and Enable Zabbix Server and Agent
sudo systemctl restart zabbix-server zabbix-agent apache2
sudo systemctl enable zabbix-server zabbix-agent apache2
Step 7: Access Zabbix Web Interface
Open your browser and navigate to http://<your-server-ip>/zabbix.
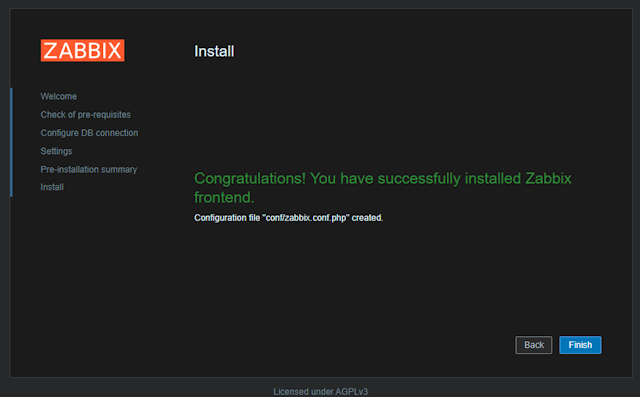
When you open Zabbix GUI for the first time it will show install dialog. Click next on welcome page.


Next, it will configure Database connection, enter the password for MySQL(if you used MySQL else you can use any other SQL like PGSQL also) database and click next.

Check Zabbix's documentation for using different SQL databases ----> Click here.
After that choosing server name, time Zone and theme click next, and it will show a Pre-installation summary click next to install. After that you'll see a congratulations message.
After that navigate to
http://<your-server-ip>/zabbix and enter the default credentials for Zabbix (case sensitive)Username: Admin
Password: zabbix
And you'll see Zabbix dashboard

Note: This guide only covers installation in Ubuntu server if you choose another distro of your choice then checkout here.
Zeek/Bro
Step 1: Install Pre-requisites
echo 'deb http://download.opensuse.org/repositories/security:/zeek/xUbuntu_24.04/ /' | sudo tee /etc/apt/sources.list.d/security:zeek.list
curl -fsSL https://download.opensuse.org/repositories/security:zeek/xUbuntu_24.04/Release.key | gpg --dearmor | sudo tee /etc/apt/trusted.gpg.d/security_zeek.gpg > /dev/null
sudo apt update
Step 2: Install Zeek
# sudo apt install [zeek, zeek-6.0, or zeek-nightly] choose desired version.
sudo apt install zeek# This will install Zeek in /opt directory
Step 3: Configure Zeek
# This will add symlink for all tools to /use/local/binfor tool in /opt/zeek/bin/*; do sudo ln -s "$tool" /usr/local/bin/; done# Change network interface namesudo nano /opt/zeek/etc/node.cfg # Chanege the interface name according to your interface.

Step 4: Run Zeek
sudo zeekctl deploy# Outputchecking configurations ... installing ... removing old policies in /opt/zeek/spool/installed-scripts-do-not-touch/site ... removing old policies in /opt/zeek/spool/installed-scripts-do-not-touch/auto ... creating policy directories ... installing site policies ... generating standalone-layout.zeek ... generating local-networks.zeek ... generating zeekctl-config.zeek ... generating zeekctl-config.sh ... stopping ... stopping zeek ... creating crash report for previously crashed nodes: zeek starting ... starting zeek ...
Step 5: Check Zeek Status
sudo zeekctl status# OutputName Type Host Status Pid Started zeek standalone localhost running 8551 07 Aug 04:36:33
Note: This guide only covers installation in Ubuntu server if you choose another distro of your choice then checkout here.
Exploring the GUI Panels
Nagios Core GUI
- Home Dashboard: Displays the current status of your network services and hosts.
- Service Status: Lists all monitored services and their current states (OK, Warning, Critical).
- Host Status: Shows the status of all monitored hosts.
- Alerts: View detailed logs of alerts and notifications.

To monitor using Nagios, add hosts and services in the configuration files located in /usr/local/nagios/etc/objects/ and set up notifications to receive alerts.
Zabbix GUI
- Dashboard: Provides an overview of your network's health with widgets for problems, latest data, and graphs.
- Monitoring: Access sections like Latest Data, Triggers, and Graphs to drill down into specific metrics.
- Configuration: Add hosts, create templates, and define items, triggers, and actions for monitoring.

To monitor using Zabbix, add hosts under Configuration -> Hosts and link them to templates that include items (metrics), triggers (alerts), and graphs.
Using Zeek/Bro
Zeek operates primarily through the command line and generates detailed logs of network activity. Here's how you can use Zeek to monitor your network:
- Run Zeek: Use
sudo zeekctl deployto start monitoring. - Logs: Check logs in
/usr/local/zeek/logs/current/for detailed insights into network connections (conn.log), HTTP traffic (http.log), and more.
1723006262.098783       C6KdoJtaEJhot9Cz9       192.168.159.147 40993   192.168.159.149 38089   tcp     -       0.000477        0       0       REJTT       0       Sr      1       44      1       40      -
1723006262.098783       CQri7dKDpczcZHWB2       192.168.159.147 40993   192.168.159.149 46910   tcp     -       0.000502        0       0       REJTT       0       Sr      1       44      1       40      -
1723006262.098783       CA4WJBfQ200rESn5i       192.168.159.147 40993   192.168.159.149 20691   tcp     -       0.000508        0       0       REJTT       0       Sr      1       44      1       40      -
1723006262.099314       CSdQ912thIubJyzOAl      192.168.159.147 40993   192.168.159.149 29580   tcp     -       0.000014        0       0       REJTT       0       Sr      1       44      1       40      -
1723006262.099314       CMM7J24ytkPbkKADv6      192.168.159.147 40993   192.168.159.149 35908   tcp     -       0.000019        0       0       REJTT       0       Sr      1       44      1       40      -
Security Recommendations
- Regular Updates: Keep all your monitoring tools updated to the latest versions to protect against vulnerabilities.
- Access Controls: Restrict access to the monitoring interface and sensitive logs. Change default password in tools.
- Encryption: Use SSL/TLS to encrypt communications between the monitoring tools and your devices.
- Alerts: Configure alerts to notify you immediately of any suspicious activities or critical issues.
- Backups: Regularly back up your configuration files and logs to ensure you can recover from any incidents.
Wrapping Up
And there you have it! With Nagios Core, Zabbix, and Zeek all set up and configured, you’re now equipped to monitor and secure your network like a true ninja. Keep an eye on your dashboards, watch those logs, and stay alert to any suspicious activities. Happy monitoring, and may your network always stay secure! 🎉
